

But case rates vary between neighbourhoods, and some areas are reporting far higher rates than others. These are the 19 areas of Wakefield, Pontefract and Castleford where Covid rates are rising or falling - and how much they have changed by in recent weeks. Areas where two or fewer cases were confirmed in a given week, or two weeks of consecutive data are not available, may not be included in the data below.
The seven day rolling rate of infection across the Wakefield district currently stands at 62.3 per 100,000 people.
Please note: Data is provided for each of the district's Middle layer Super Output Areas (MSOAs), which may not always tally with local authority wards.
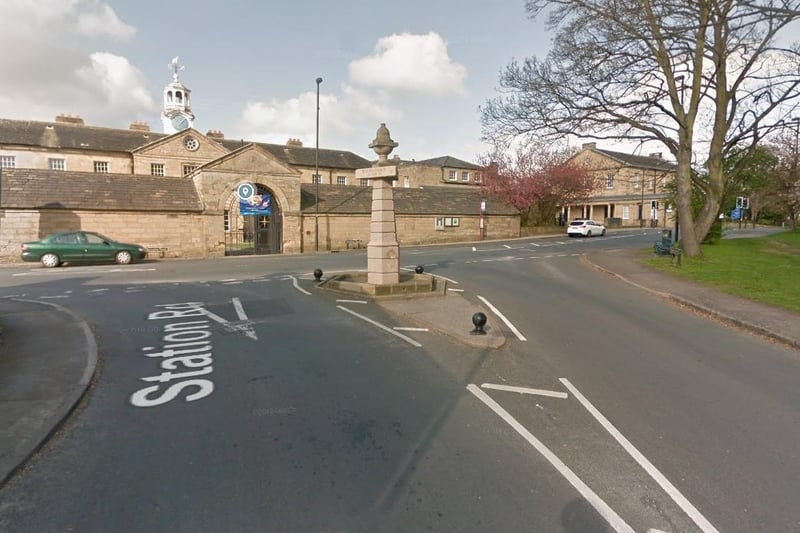
1. Ackworth & Darrington
10 people in Ackworth & Darrington tested positive for Covid-19 in the seven days up to June 5, bringing the rolling rate to 89.4 per 100,000 people. This is a 41.2% fall from the previous week. Photo: Google Maps
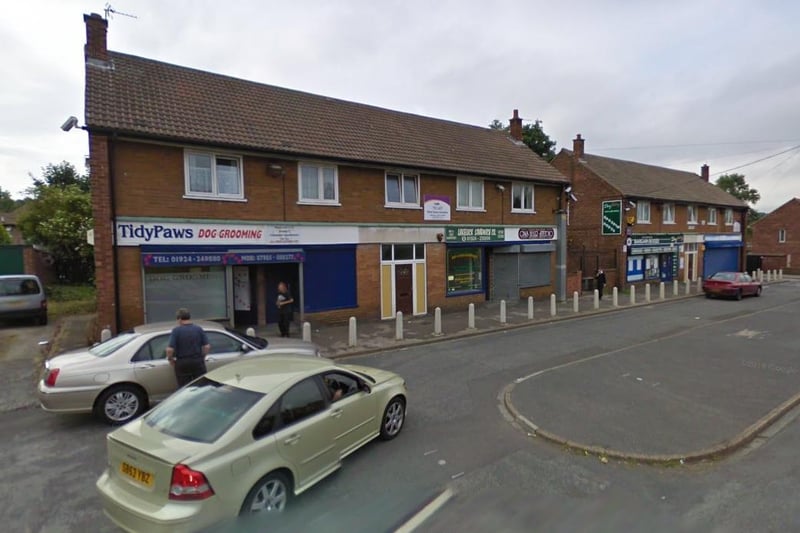
2. Agbrigg & Belle Isle
24 people in Agbrigg & Belle Isle tested positive for Covid-19 in the seven days up to June 5, bringing the rolling rate to 265.7 per 100,000 people. This is a 33.3% rise from the previous week.
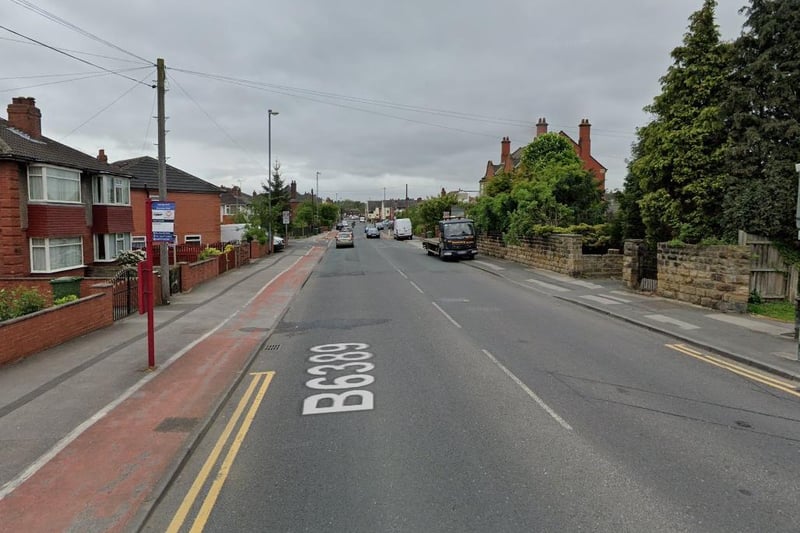
3. Alverthorpe & Flanshaw
Seven people in Alverthorpe & Flanshaw tested positive for Covid-19 in the seven days up to June 5, bringing the rolling rate to 71.9 per 100,000 people. This is a 16.7% rise from the previous week. Photo: Google Maps
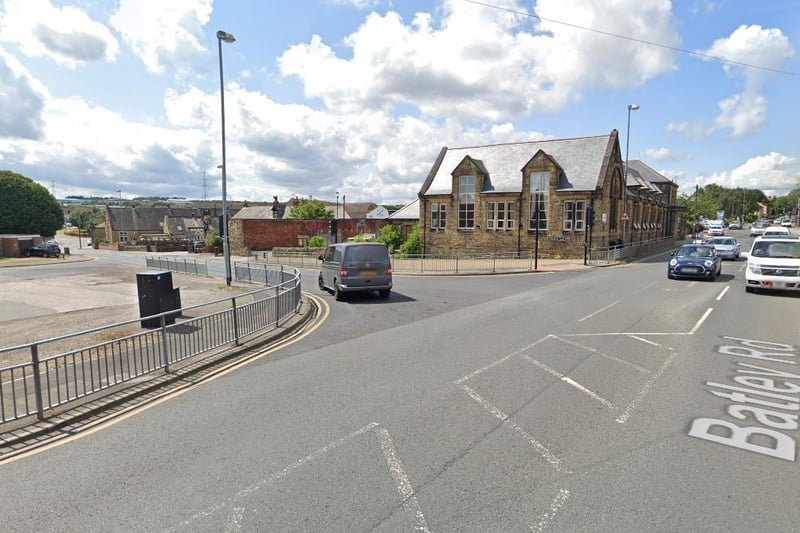
4. Kettlethorpe & Chapelthorpe
Nine people in Kettlethorpe & Chapelthorpe tested positive for Covid-19 in the seven days up to June 5, bringing the rolling rate to 134.1 per 100,000 people. This is a 80% rise from the previous week. Photo: Google Maps